Covid-19 Bus Model Presentation
In this website, we will introduce our project, go over the logistics, and put out some visualization on the outputs.
Introduction
Over the past 14 months, the world has experienced a global outbreak of the coronavirus (SARS-CoV-2), a dangerous respiratory condition, and it has accumulated a total of over 117 million cases and over 2.6 million deaths as of March 2021. In January of 2020, COVID-19 was declared as a public health emergency by the World Health Organization. At the current state of loss that we have experienced as a global society, with projections of continuous damage in the future, it is crucial to study and understand the virus, so we can start to contain its spread.
We are focussing on controlling the spread of the coronavirus, as it relates to the reopening of schools for in-person education. Specifically, we are investigating infections of this virus in a school bus setting, intending to simulate the spread of COVID-19, using agent-based modeling. We will simulate the bus journey that school children travel through, and map out the bus, with programmed virtual agents that represent the students, seating patterns in buses, movement, activities, and the infection spread through the source patient(s). Agent-based modeling is a useful tool to simulate real-life events so that we don’t have to create an actual experiment to further study them. This avoids any risk, costs, and human effort that experiments may entail. The purpose of our simulation is to be able to observe and analyze the effect of changing measurable parameters such as the number of passengers, passenger movement, passenger activities, and interactions, zip codes in which passengers reside, duration of the bus ride for each passenger, social distancing, wearing masks and their types, risk radius, air changes per hour, etc. on the impact and spread of the virus, and understand how we can use this knowledge to set better precautions and preparations for future group travel during this pandemic, such as children going to school, and minimize disease infection risk among the population. Our results will include guidelines on key parameters to focus on for safe school reopening.
Methods
ABM
We chose agent-based modeling to simulate the worship event last quarter and to simulate school bus trips this quarter. ABM is a type of modeling where we can simulate the actions of a group of autonomous agents and assess their impact on the system. An agent in an ABM is an individual or collective entity, which is the subject of the modeling effort. Each agent is defined by its properties and its relationships with other agents. Agents perform autonomous decision making and each one can have different characteristics, traits, and behaviors. Agents are simulated to move around, make decisions, perform tasks, and interact with each other so we can view and assess their effects on the system. In our case of modeling COVID-19 transmission in the school bus, agents are the individual students that take the bus to school in the morning and back home in the evening. ABM allows interaction between these agents based on a set of rules, and each agent can be given different attributes and make different decisions, allowing the model to monitor and detect individual-level behaviors and interactions. These individual mobility and social networks are an important component in the spread of diseases, and ABM can detect and capture these interactions.
Data
The data we use to integrate with our bus model for our simulations comes from the San Diego Unified School District database. This dataset contains information about school bus trips in the San Diego district. We extract information about routes, timings, stops, locations, schools, and the number of students at each stop, for trips to and from the schools. This dataset included over 1100 different routes. For each route, we had a route ID, type of route (with or without wheelchair), and addresses for each stop, including the school it goes to. For each of these stops, we have address information, Thomas Brothers location, time the bus reaches the stop, and the number of students it picks up or drops off at that stop. By using spatial data manipulation services like ArcGIS and GeoPandas, we were able to find geometric locations for all of these stops in our dataset, and include the geocoded locations in our data. Most of our key parameters related to bus trips, such as trip time, the number of students at each stop, etc., are imported from this dataset, into our model.
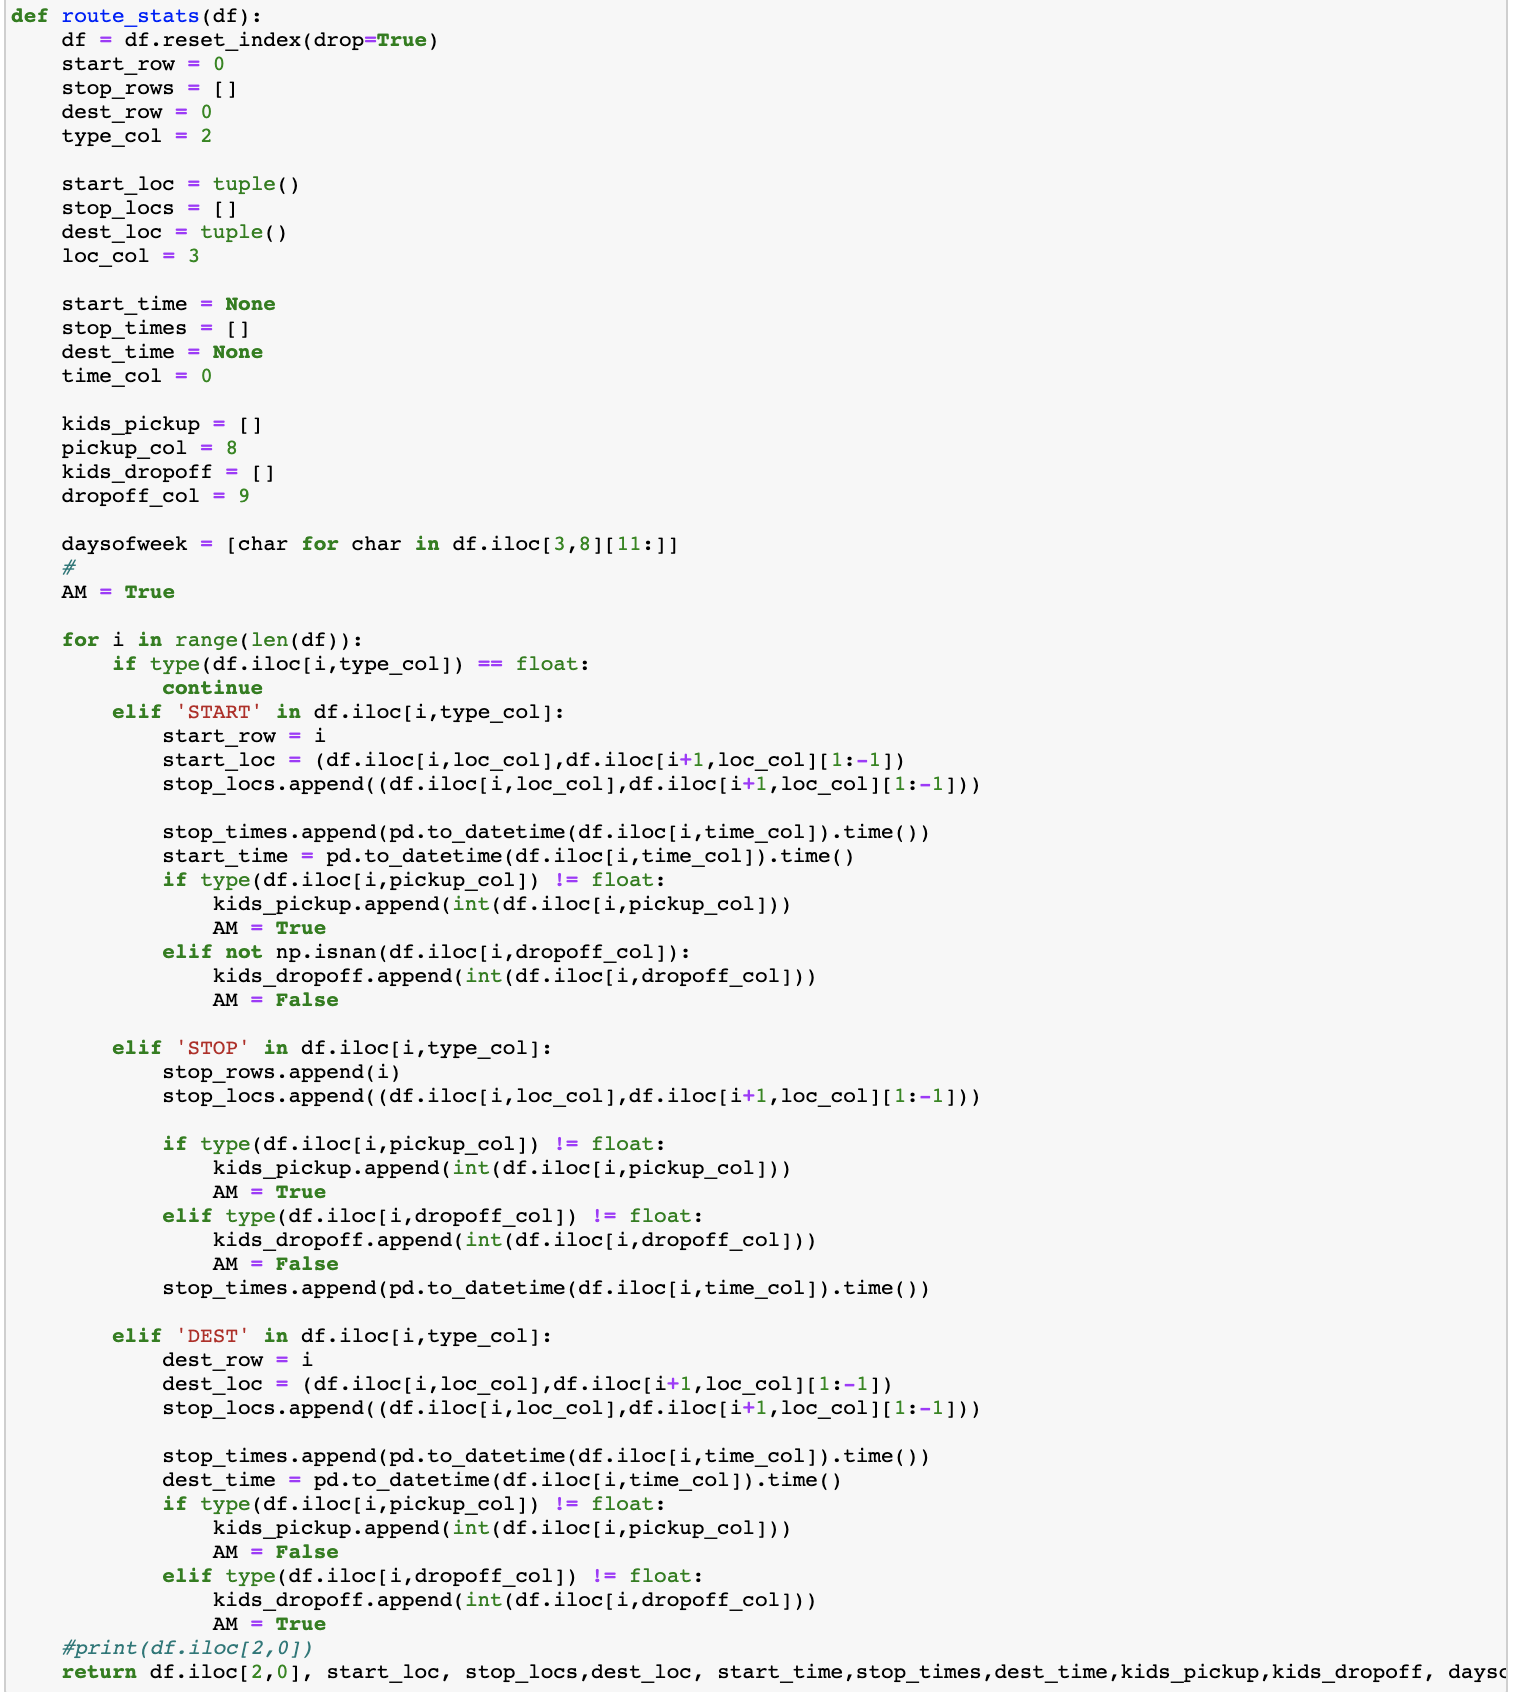
Here is a screenshot of the first function we used to clean and reformat the data:
Model Initialization
To initialize the model, we create a bus with certain features replicating a real school bus that we measured thoroughly on a field trip that happened in early February. These features include the seating arrangement, number of rows and columns of seats, dimensions of seats (width, length, height), dimensions of spaces within the bus (the aisle, legroom, etc.), and the length, width, and arc of the ceiling of the bus to measure the inside volume. We also recorded the arrangement of windows, alongside their dimensions to more accurately calculate the airflow rate during the trips. Once we have the bus initialized, we need to add our initial agents to the model. Each passenger agent has certain parameters that are set in the model initialization step. The main parameters here are the health indicator, the location of the agent in the bus, their daily schedule at school, their route id, and their bus stop id.
We do all this through the Mesa-Geo library. To initialize the model, we make an agent class with the features named above. We are using a bus class, which is a subclass to a Classroom type. The bus is similar to a classroom in many ways, such as having a limited volume with a certain air change per hour rate. They both have seats which students can take and spend some amount of time during various activities. At the same time, the bus needs some extra parameters, which led us to make it a separate class of its own. Each bus also needs to be assigned to a route, each bus needs to pick up and drop off students at certain times and locations.
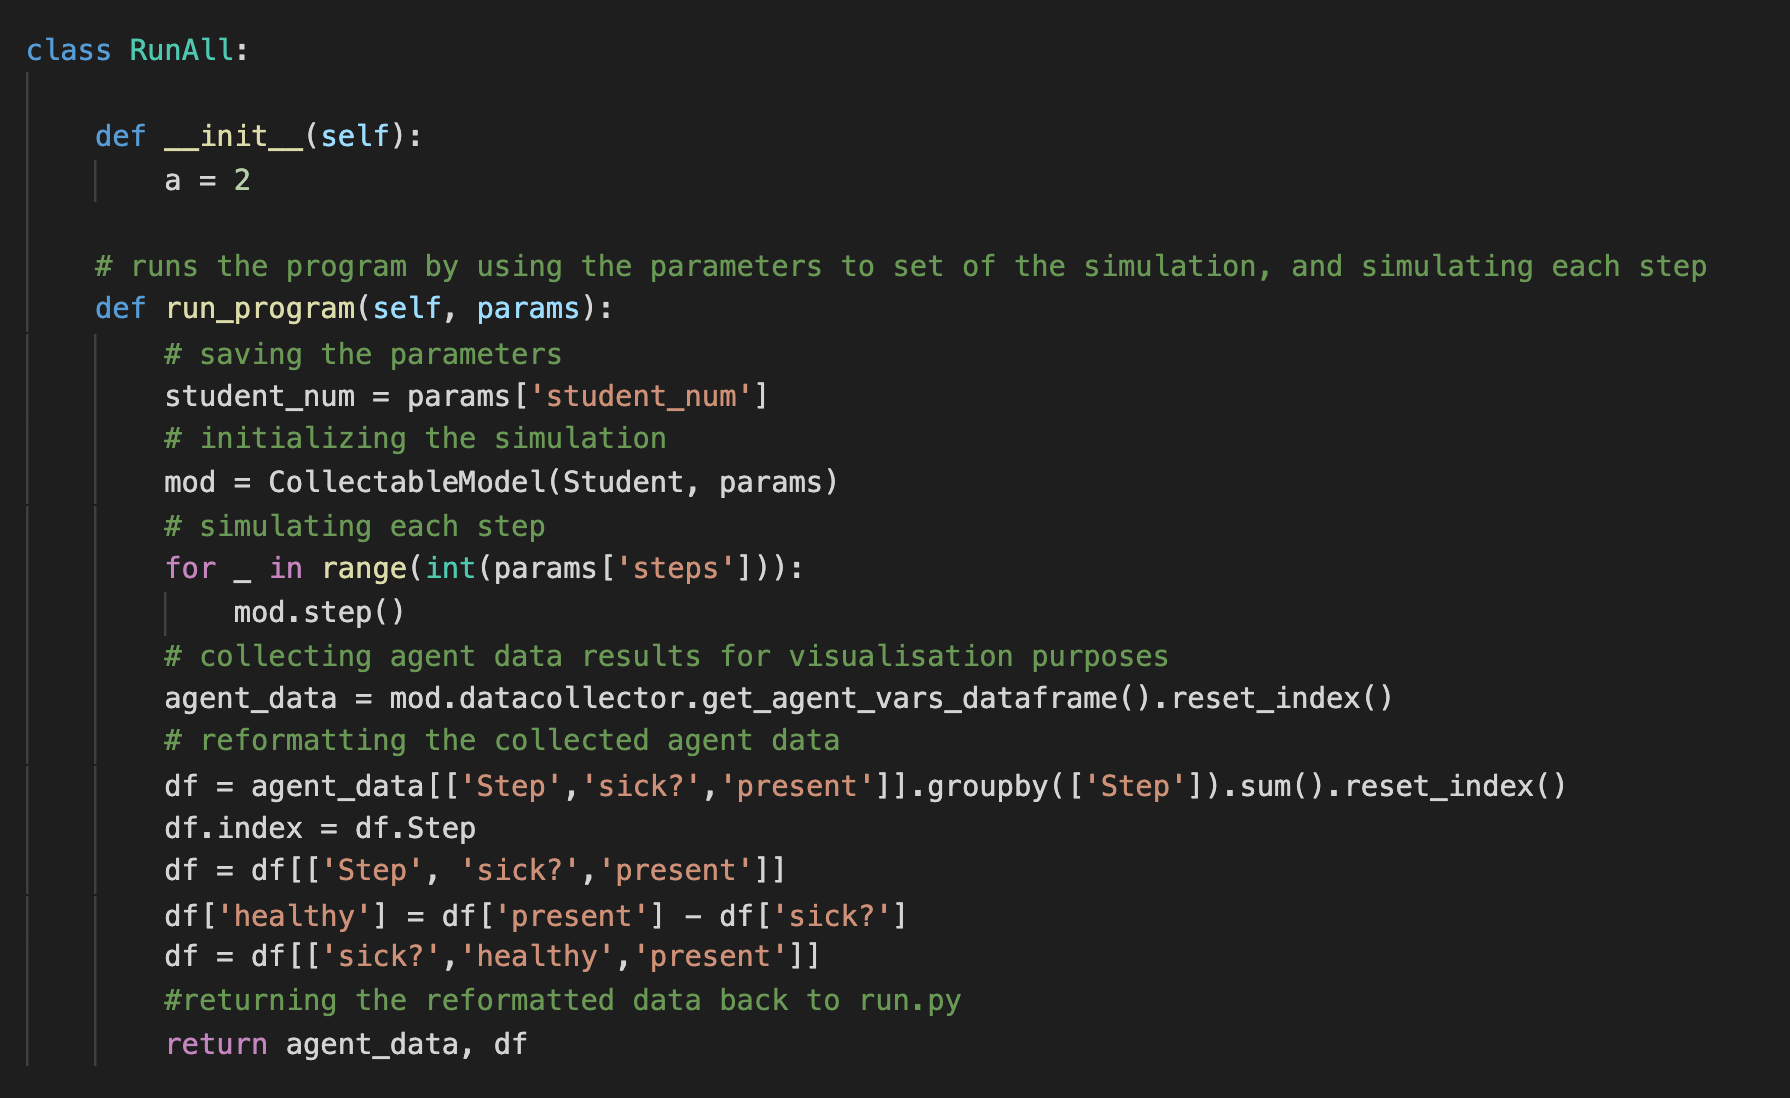
Here is the code that initializes the model:
Simulating the Model
We make changes in some of our parameters for the simulations, to be able to measure the impact of that change on the spread of the disease and try to pinpoint important factors to help slow that spread. These parameters include the details discussed in the previous paragraph about the San Diego Unified School District dataset. They also include different seating arrangements based on social distancing guidelines, mask-wearing probabilities, types of masks used, and probabilities of different activities and interactions between the students in the bus.
During our simulations, as students spend more time on the bus, the density of the virus increases in the bus atmosphere, and that results in a higher rate of transmission of the virus. We keep track of infection counts and rates during each of our simulations, and then we produce graphs of the changes in infections concerning key parameters changes, to show the impact of that particular parameter on the spread of the virus, over time and different simulations. We can simulate bus trips of children going to school, and our further analysis is collecting and analyzing infection data from these trips, based on various key factors.
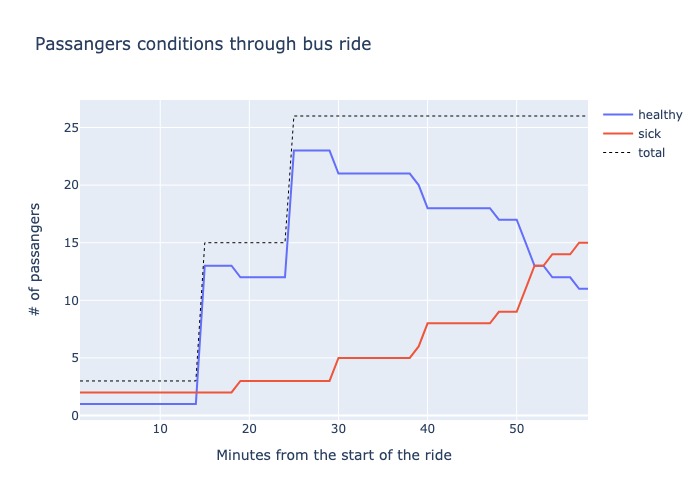
Here is a sample simulation by step:
Results
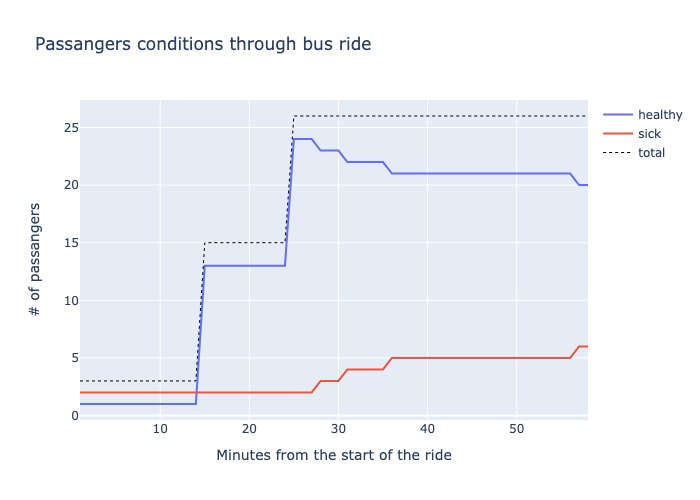
As an example, here we are simulating a real route (Route:T017 BA in SDUSD dataset) with different sets of guidelines and recording the different outcomes. At first, we had all the windows rolled up, A/C is off, and no one is wearing masks or practicing social distancing. In this example, we see how dangerous a single bus ride could be, as our initial 2 sick people infected an additional 13 students, for a total of 15 sick people (2 infectious and 13 exposed). In this example, 2/26 (7.7%) of our population was infectious and 13/26 (50%) ended up being exposed. This would be a similar outcome to the worship bus that we simulated last quarter (Shen, Ye; et al,2020). We could also see that as time goes on and the density of the virus in this closed system increases, the rate at which new students get exposed to the virus increases as well.
We then repeated the same route’s simulation with 90% of the students wearing masks, but still without any outside air circulation or social distancing within the bus. In this scenario, we see that the spread is much slower, but it still happens within the 58-minute trip. In this example, 2/26 (7.7%) of our population was infectious and 4/26 (15%) ended up being exposed.
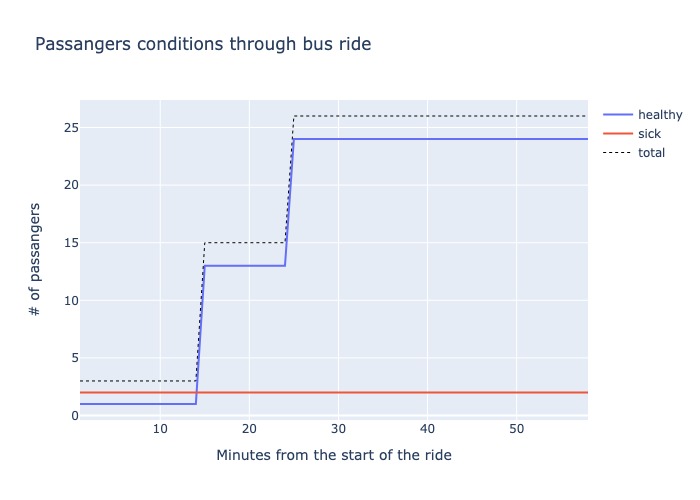
Finally, we repeated the experiment with 100% of the students properly wearing masks, windows rolled down, and students seated in a zigzag pattern where they maximize their distances. In this simulation, none of the 24 healthy students got exposed to the virus in this 58-minute bus ride to school.
Conclusions
By simulating different scenarios, we realized that certain actions would have certain effects on slowing the spread of COVID-19 in San Diego school buses. Firstly, the windows of the buses must be open so that the air changes per hour hit values higher than 20 on average. At that stage, the chances of getting the virus through the aerosol model minimize to the point where it is negligible. The second most important conclusion was that to overcome droplet transmission, social distancing within the bus is very important. By putting more distance between the sick and the healthy students, we lower the chances of transmission substantially. On top of this distance, we need our masks more than ever to block the droplets that move towards us while a sick person around is breathing, talking, coughing, or sneezing.
In conclusion, the following set of procedures would provide the most safety to the students in San Diego buses: Each student must: wear masks and keep them on at all times during the ride, limit their interactions with other students as much as possible, avoid drinking or eating on the bus. Each bus must: keep the windows open at all times and not let the windows be closed, have A/C off or if A/C is on, have it on outside air circulation mode. Each school must: Assign seats to students at the beginning of the semester, make sure the students who go through similar schedules during the day are matched to take the same buses as much as possible.